Free public beta
See the fixture. Read the matchup. Make the move.
Everything you need to decide your next Fantasy Premier League move — all in one place. Compare players, explore matchups and see how every option fits your team.
Built for desktop and mobile. Use it in your browser or add it to your Home Screen.
The problem
Stop opening five tabs to make one transfer
One FPL decision usually means a stats site, a fixture grid, a price tracker and your own team open at once — then stitching the answer together yourself. Ace Analyst keeps the whole decision in one place.
01
Compare the players
Put the two options side by side — output, per-90 rates, value and availability — instead of holding two tabs in your head.
02
Check the fixture
See the run ahead for both, with the official difficulty rating and blanks and doubles marked rather than smoothed over.
03
Read the matchup
Look past the colour of the fixture to how a player has actually gone against the specific opponent he is about to face.
04
See how it fits
Drop the option into your own squad, check the budget and the knock-on effects, then make the call yourself.
No black-box picks. Ace Analyst puts the evidence in front of you and leaves the final call where it belongs — with you.
The product
Start from the decision, not the spreadsheet
Every gameweek asks you a different question. Each part of Ace Analyst answers one of them, and they all read from the same data — so the answers agree with each other.
My Team
What do I do with my squad this week?
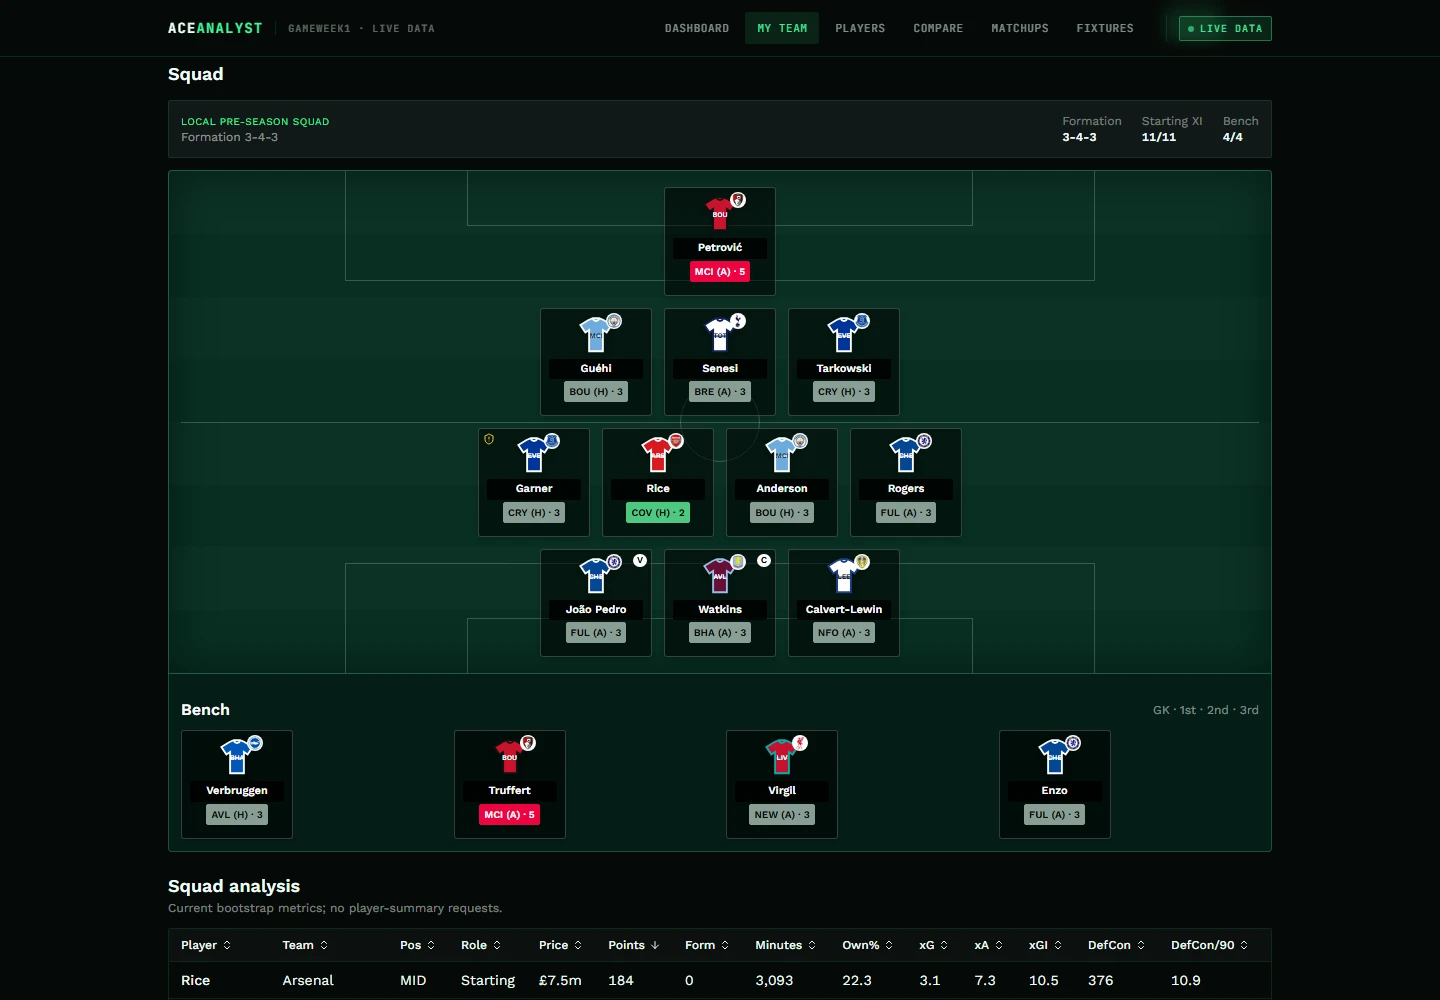
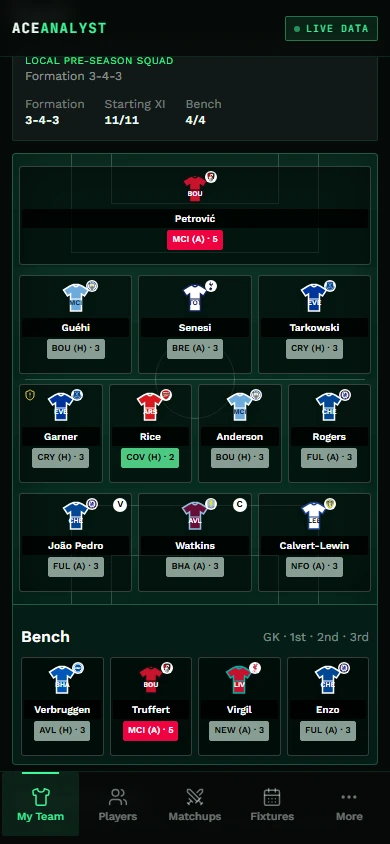
Your XI, bench, captain and vice all in one view, each player carrying his own upcoming fixture difficulty — so the weak links show themselves.
Review your squad in Ace AnalystCompare
Which of these two is actually the better move?
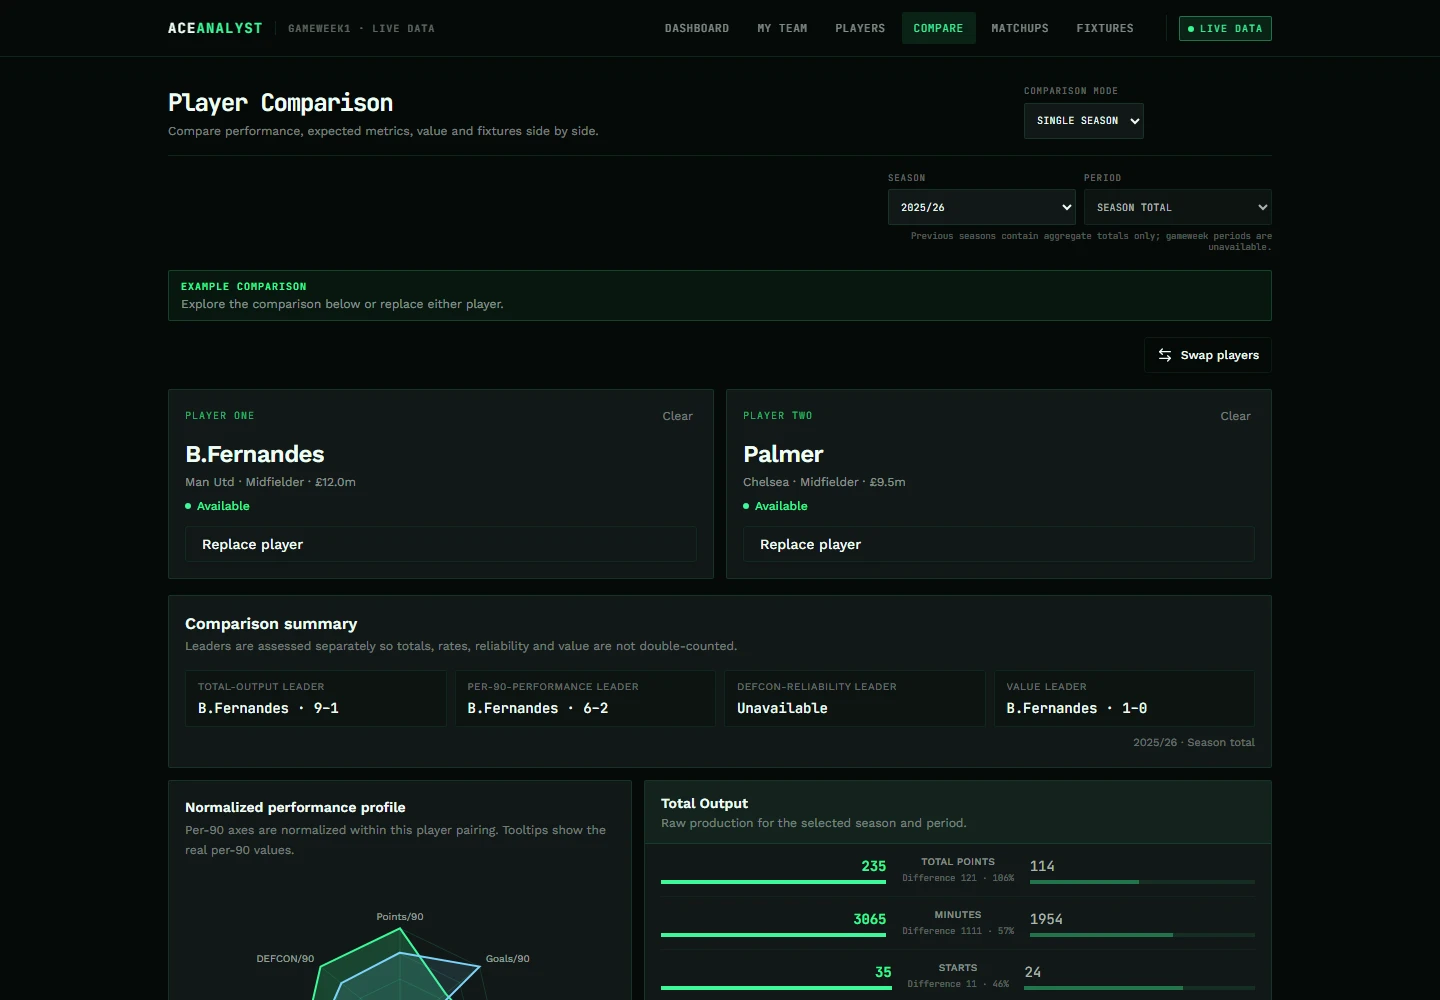
Two players, the same metric set, side by side — total output, per-90 rates and value, with no hidden weighting collapsing it into one score.
Compare players in Ace AnalystMatchups
How does he do against this opponent?
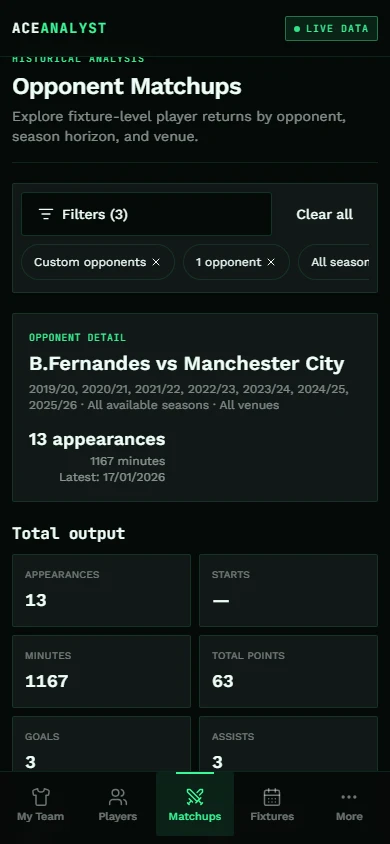
Fixture-level history against the specific teams a player is about to face, including his next three opponents picked out automatically.
Analyse matchups in Ace AnalystFixtures
Who has the kinder run from here?
The whole league's schedule in one grid with the official difficulty rating, and blanks and doubles marked rather than smoothed over.
Explore fixtures in Ace AnalystPlayer Explorer
Who is even worth looking at?
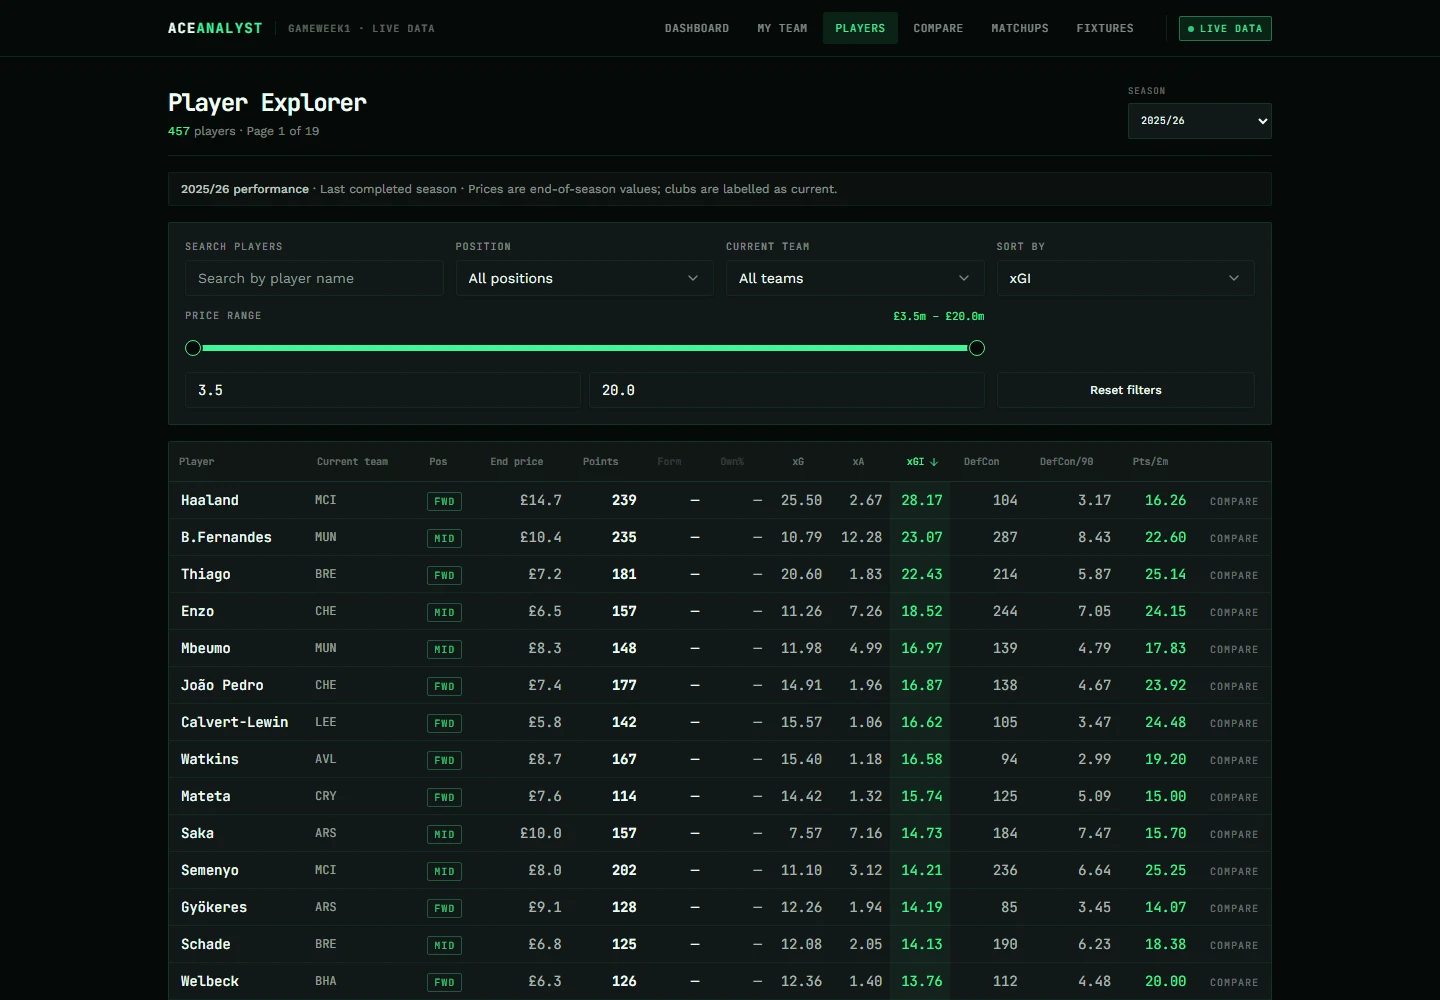
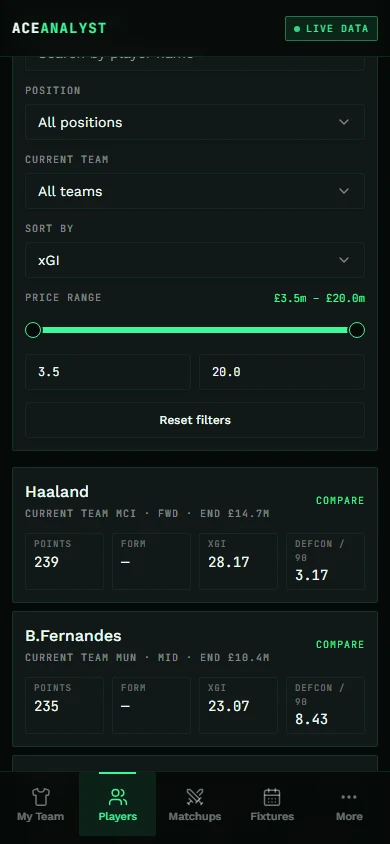
Filter and sort the full player pool on price, form, ownership, expected stats and value to build a shortlist worth investigating.
Find players in Ace AnalystDashboard
What deserves my attention right now?
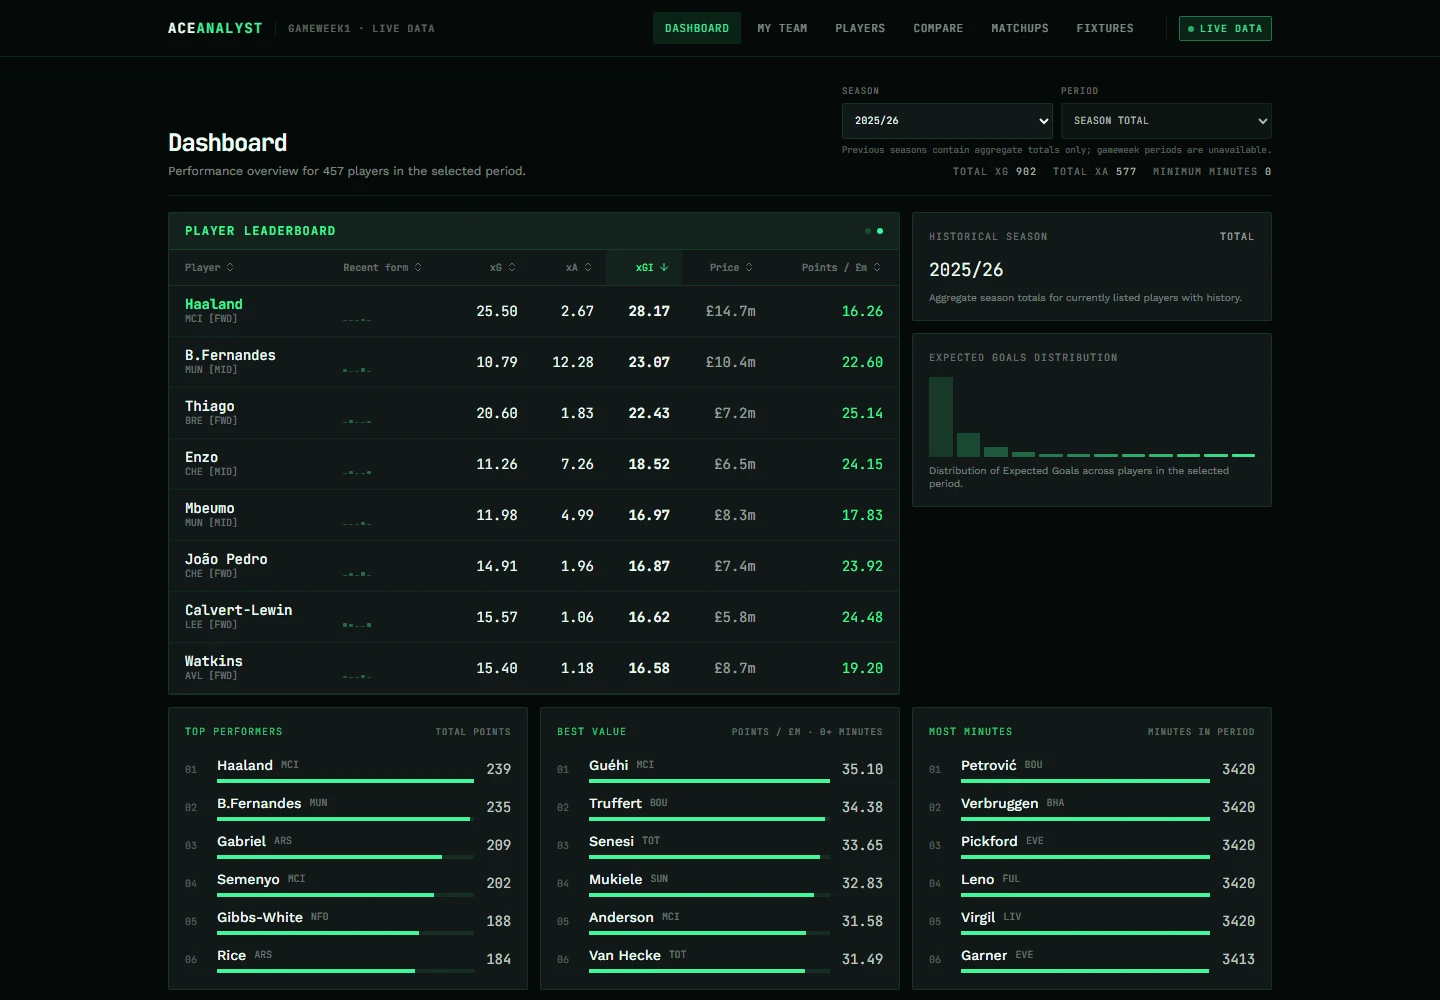
Leaderboards, expected-goal distribution, best value and top performers — the wide read that tells you where to look closer.
Open the dashboard in Ace Analyst
Opponent Matchups
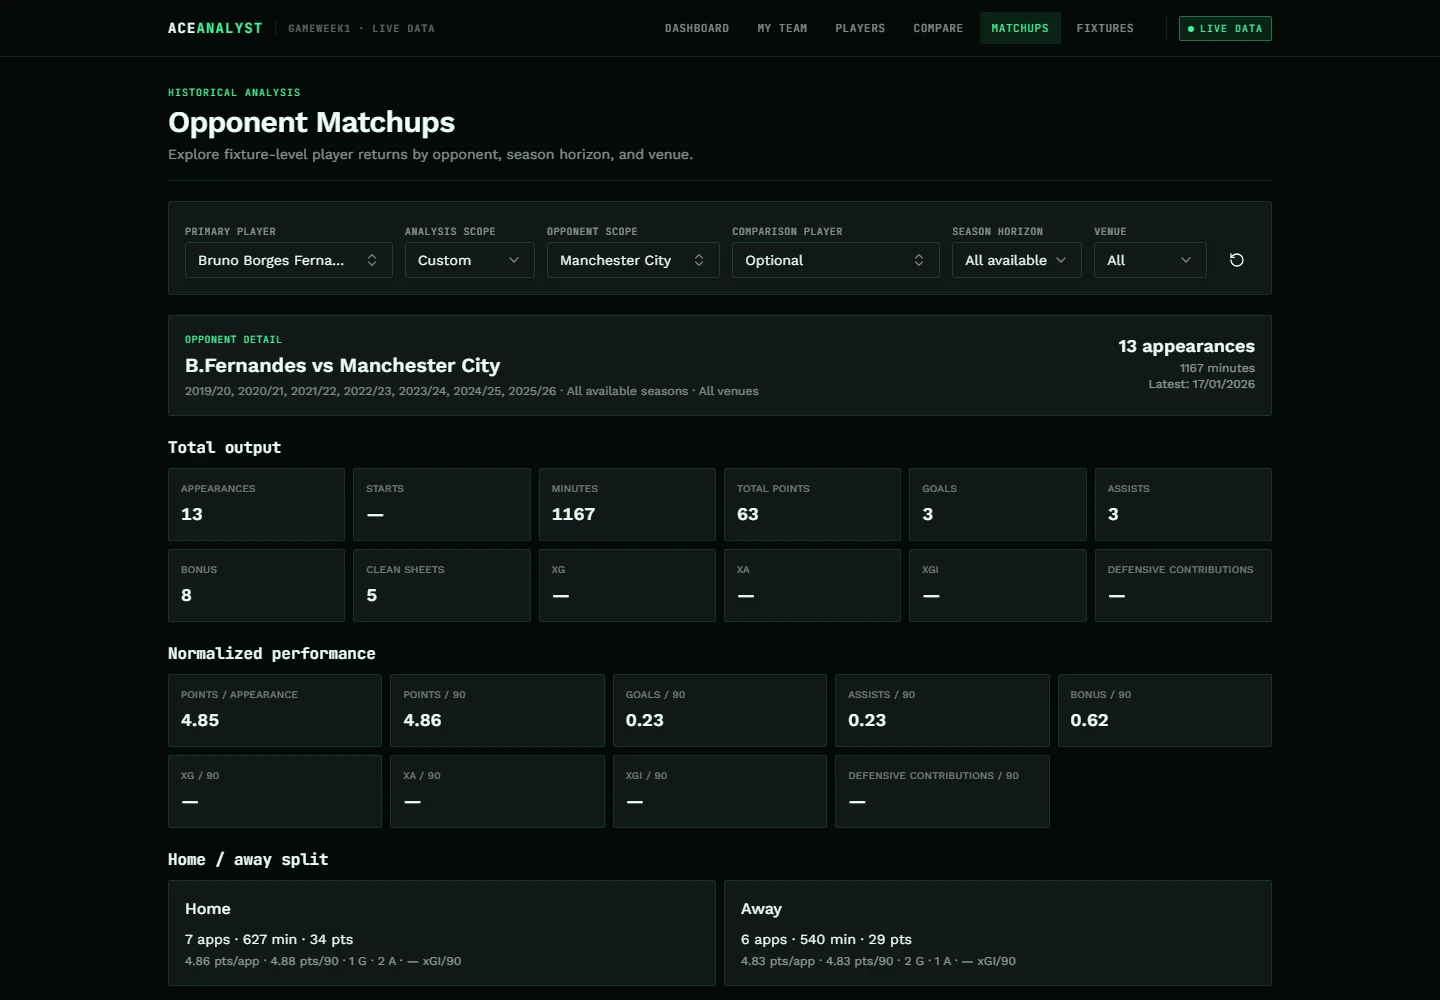
Total points tell you what he did. Matchups tell you who he did it to.
Some players turn up against the teams they are about to face. Others quietly disappear. Ace Analyst holds years of fixture-level history, so you can tell which is which before you hand over the armband.
- Check one opponent, several, or every team a player has faced
- Let the app pick out his next three actual fixtures
- Split the record by home and away
- Choose how far back the history reaches
- Read totals and per-90 rates side by side
- Drop into the individual matches behind the numbers
Upcoming 3
The next three fixtures, already joined to the history.
Ace Analyst works out who a player actually faces next and pulls his record against those exact opponents — no manual opponent picking, no second tab.
Read this correctly
This is historical context, not a prediction. Samples can be small, and what a player did against an opponent before does not decide what he does next.
My Team — Overview and Transfers
See how the move actually fits your team
Drop in your public FPL team ID and Ace Analyst rebuilds the squad you already own. Overview is your current squad; Transfers is a separate draft where you can try a move, see what it does to your budget and undo it — none of which touches your real team.
- Overview: your XI and bench laid out as a pitch, not a table
- Captain and vice-captain in context
- Official fixture difficulty on every player
- Squad diagnostics and availability flags
- Transfers: try a move, then a second, then a third
- Budget and possible hits estimated as you go
- Undo a planned move or restore the original squad
- Drafts saved in your browser and reopened after a refresh
Every number says what it is
Exact selling prices and saved free transfers are not public data. Ace Analyst does not paper over that — it labels each figure for what it actually is.
- Exact
- Taken straight from public FPL data.
- Estimated
- Derived where the official figure is not public.
- Your assumption
- Values you tell Transfers to assume.
- Unavailable
- Left blank rather than quietly filled with zero.
Privacy
Only the public FPL team ID is used. Ace Analyst never asks for an FPL password, authentication cookies or private login credentials.
Player Explorer and Compare
Two players. One metric set. No hidden weighting.
Most tools either bury you in columns or collapse everything into a single score you cannot argue with. Ace Analyst splits a player into the parts that actually decide a transfer, and leaves the call to you.
- What he returned
- Total output across the period you choose — points, goals, assists, minutes.
- Whether he earned it
- Per-90 rates, so heavy minutes don't disguise thin underlying output.
- What it costs you
- Price, points per million and ownership, for the differential call.
- What's coming next
- The fixture context sitting behind the numbers you're comparing.
Metrics available
- Price
- Total points
- Form
- Ownership
- Expected goals
- Expected assists
- Expected goal involvement
- Per-90 performance
- Points per million
- Defensive Contributions
- Defensive Contributions per 90
- Upcoming fixture context
Fixtures and FDR
Plan past the next gameweek
A transfer that looks sharp this week can be dead weight in three. The fixture grid shows the whole league's run at once, with the awkward gameweeks marked rather than smoothed over.
- Official Fixture Difficulty Rating on every fixture
- Team xG and clean-sheet probability for near-term fixtures
- The whole league in one matrix, or one team in focus
- Home and away shown separately
- Blank gameweeks marked, not hidden
- Double gameweeks shown in full
- Horizons from the next few weeks to the longer run
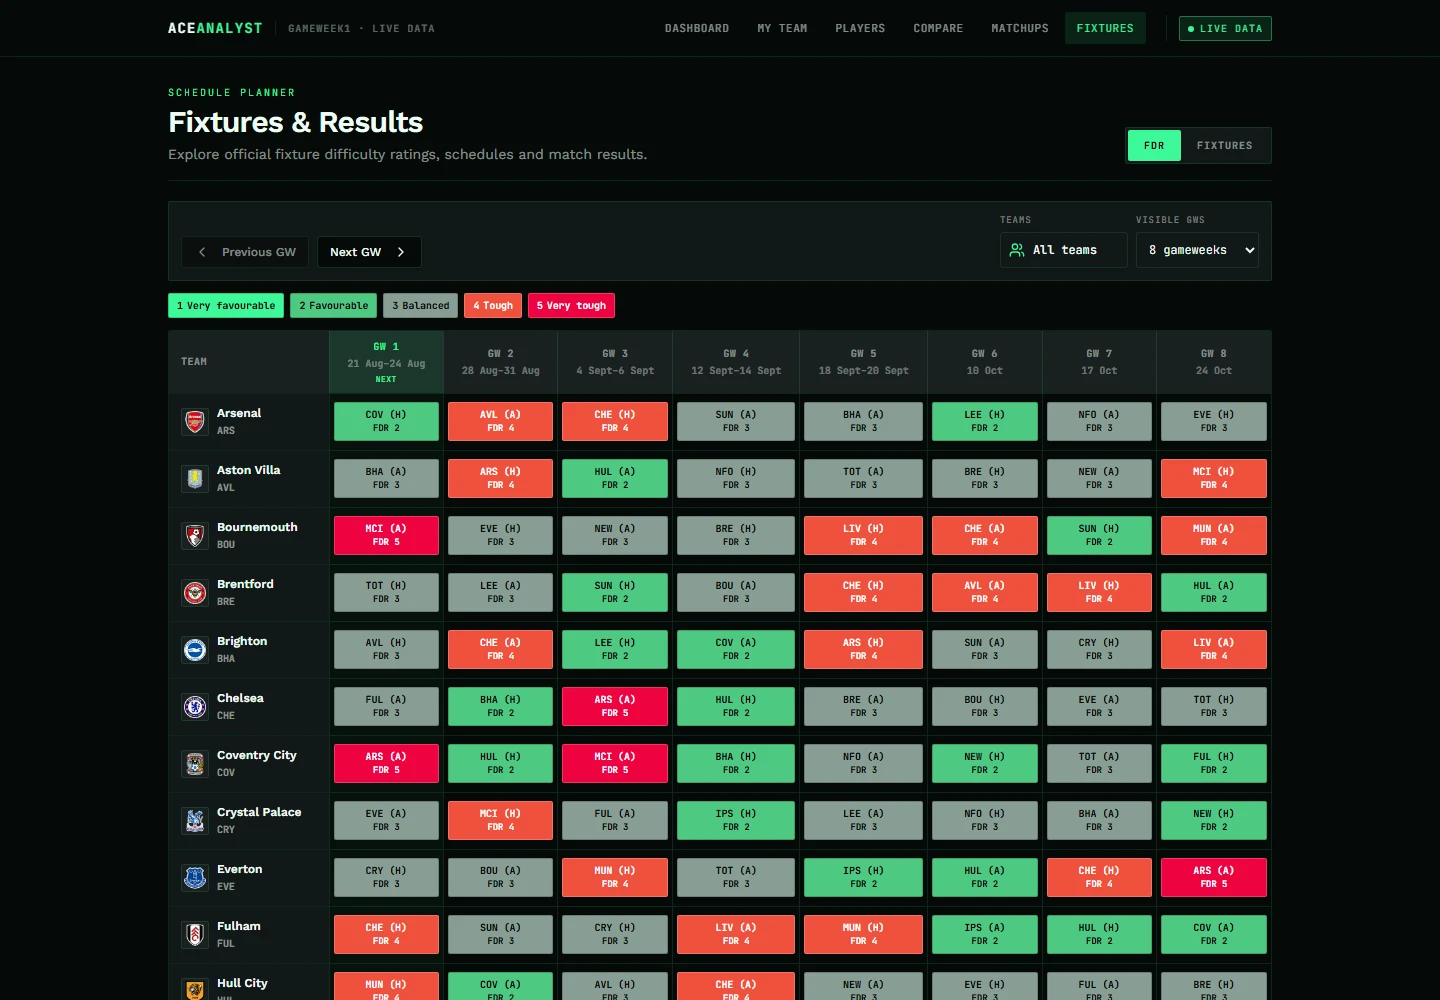
The real thing
Every screen here is the live application
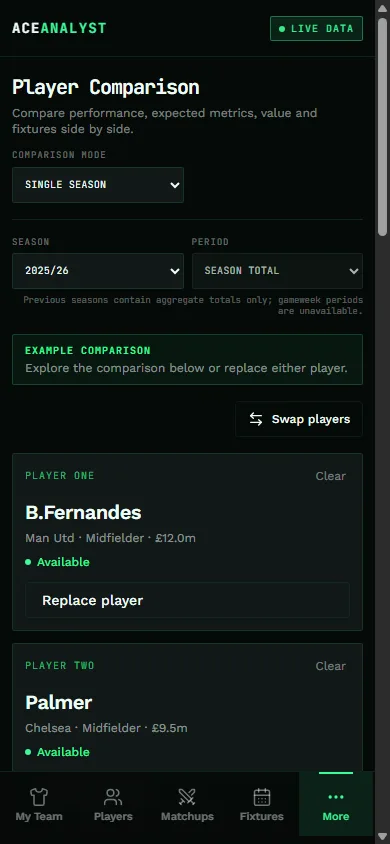
No mockups and no marketing renders. This is what you get when you open it — including on the phone you actually check your team on.
Deadline day rarely happens at a desk
On a phone the presentation changes — tables reflow, filters stack — but the metrics, scopes and caveats all survive the trip. Nothing gets dropped just because the screen got narrower.
Keep exploring
More of the workflow
- Player comparisonTwo players, side by side — total output, per-90 rates and value.
- Fixture difficultyThe whole league's run in one grid, official FDR included.
- Player matchupsUp to seven seasons of fixture-level history behind the fixture.
- Team plannerPlan a transfer against your actual squad before you commit it.
- AboutWhat Ace Analyst is, who it's for and what it does today.
- MethodologyHow per-90 rates, multi-season aggregation and FDR actually work.
- DataWhere the current and historical FPL data comes from.
Desktop and mobile
Your FPL decision toolkit, wherever you manage your team
The same product either way. Compare players, explore matchups and plan your next move on desktop or mobile — in your browser, or straight from your Home Screen.
On desktop
Room to spread out — compare several options, work through the fixture grid and read the matchup detail before you commit to anything.
On your phone
The deadline rarely arrives while you are at a desk. Check your squad, run a quick comparison and plan the move from wherever you are.
Home Screen
Add Ace Analyst to your Home Screen and it opens with a single tap, app-like, straight from your browser. No App Store download required — the FAQ has the two-step version for iPhone and Android.
Why Ace Analyst
Built to help you decide, not to decide for you
Plenty of tools will hand you a name and a confidence score. Ace Analyst shows you the evidence behind the choice — and is straight with you about how strong that evidence actually is.
01
No black-box picks
Nothing hides behind one unexplained rating. You see what is driving the comparison, then make the final call yourself.
02
One connected picture
Squad, comparison, fixtures and matchup history all read from the same data, so moving between them never means reconciling four different answers.
03
Honest about the gaps
Where a number genuinely isn't available it says so. Estimated prices, budgets and free-transfer assumptions are labelled as estimates, every time.
04
Nothing to hand over
No account, no password, no FPL login. Squad analysis runs from the public team ID alone, and transfer drafts stay in your own browser.
The thinking behind it
Built by an analyst who got tired of twelve open tabs

Ace Analyst is built by José Coelho, a Business Intelligence and analytics professional based in Portugal, with a Master's degree in Information Management specialising in Business Intelligence and professional experience in analytics, data engineering, automation and decision-support products.
The problem it solves is a familiar one. Everything needed to make a decent FPL call already exists, but it is scattered — a fixture grid in one tab, expected goals in another, a half-remembered stat about how someone plays against Everton in a third. The analysis is possible. It is just tedious enough that most of us skip it and go with a feeling instead.
So Ace Analyst applies what analysts do professionally — pull the sources together, keep the calculations transparent, stay honest about what the data can and cannot support — to the decisions FPL managers actually face every week. The aim is not to hand out predictions. It is to make the useful analysis quick enough to be worth doing.
Spotted a gap, or something that would genuinely help? Get in touch — feedback shapes what gets built next.
What that means in practice
Show the working
If a number changes your decision, you should be able to see where it came from and over what period it was measured.
Respect the gaps
Real data has holes in it. Marking one honestly is more useful than filling it with a confident-looking zero.
Answer the question asked
The point isn't more charts. It's getting to a decision faster than four browser tabs would.
FAQ
Questions, answered plainly
There's a decision waiting on you this week.
Open Ace Analyst, pull up your squad and see the comparison, the fixtures and the matchup behind the move in one place. Free public beta — no account, nothing to install.
Open Ace Analyst